
Your cut list optimizer says 18% waste. Is that good or bad, and how much plywood should you order for the next job? Before either question has an answer, you need to know what a cut list waste percentage actually counts: what it was divided by, and whether the kerf, the edge trim, the offcuts you put back on the rack and the empty end of the last sheet are inside it. This article walks through the arithmetic with worked examples, separates gross from net waste, and turns the result into an order quantity and a sheet yield you can trust.
What waste percentage is “normal”? The honest answer
There is no agreed standard. The thresholds you find online come mostly from cutting software vendors and calculator sites, and they do not agree with each other. One Argentine calculator site, for example, grades sheet yield as “a lot of scrap” below 55%, “normal” from 55% to 80% and “a very good cut” above 80% (Hacé Cuentas); other vendor pages draw the lines somewhere else entirely. These are classifications from commercial websites, not from any standards body.
The bigger problem is not that the thresholds differ. Two waste percentages cannot be compared unless you know what each one counts. One divides by part area, another by sheet area; one deducts the offcuts that go back on the rack, another does not; one counts the empty half of the last sheet, another leaves it out. The same cutting plan can come out at 7% or at 29% depending on those choices, as the examples below show. The rest of the article takes them one by one and ends with the four numbers per job that let you build a benchmark of your own.
The formula: what goes on top, what goes underneath
The most common definition of a cut list's waste percentage is this: take the area of the stock you used, subtract the area of the parts, and divide what is left by the stock area. For bars, tubes and profiles (one-dimensional cutting) you use length instead of area; the logic is the same.
Waste % = (stock area used − part area) ÷ stock area used × 100
Worked example A: a single 2800 × 2070 mm sheet yields 4.90 m² of parts. (The sheet size is just an example, not a standard.)
| Sheet area | 2.8 × 2.07 = 5.796 m² |
|---|---|
| Part area | 4.90 m² |
| Waste area | 5.796 − 4.90 = 0.896 m² |
| Divided by sheet area | 0.896 ÷ 5.796 = 15.5% |
| Divided by part area | 0.896 ÷ 4.90 = 18.3% |
Same sheet, two “waste percentages”. Both are arithmetically right; they answer different questions. Divided by sheet area, the figure answers “how much of the material I bought did not become parts?”. Divided by part area, it answers “how much do I add on top of what I need?”: add 18.3% to 4.90 m² and you get exactly one sheet. A percentage on a report or on an optimizer's screen tells you nothing until you know its denominator.
Yield is the other side of waste
Sheet yield is part area divided by stock area: in the example, 4.90 ÷ 5.796 = 84.5%. Yield plus waste measured against sheet area adds up to 100% (15.5% + 84.5%). Yield plus waste measured against part area does not; if a sheet says “yield 84.5%, waste 18.3%”, the two numbers come from different denominators.
What is inside the waste percentage?
What is left when you subtract part area from stock area is not one thing. The waste percentage bundles five very different kinds of loss into a single number:

- Kerf. Every cut removes one saw blade's thickness of material, so its share grows as parts get smaller and cuts get more numerous. For the details, see why the kerf matters so much.
- Edge trim. The factory edge of a sheet is often not square and is thrown away as a strip on the first cut; it happens once per sheet.
- Reusable offcuts. Leftover pieces above a minimum size, big enough to cut parts from on another job. Of the five, this is the only one that can be recovered.
- Scrap. Pieces too small to be worth keeping, thin strips between parts. Always waste.
- The empty end of the last sheet. The last sheet of a job is often only partly used. It deserves its own section, because it is what moves job waste the most (below).
Gross waste and net waste
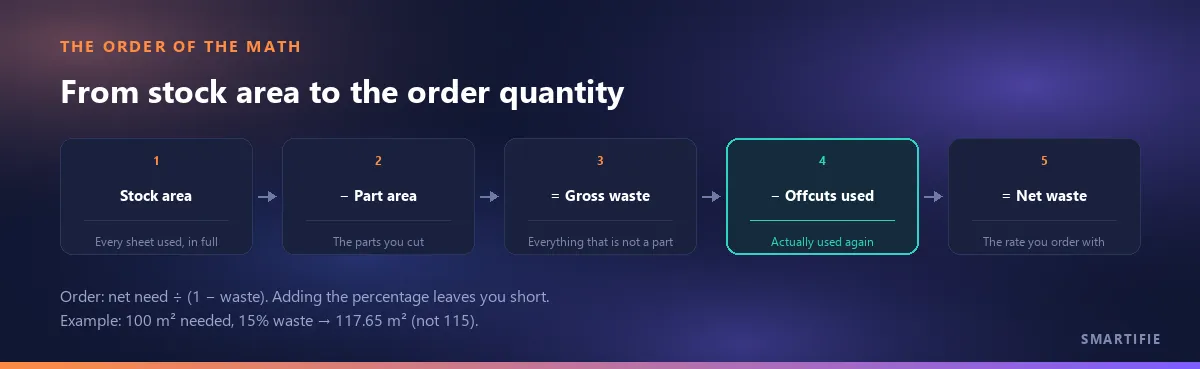
Gross waste is everything that is not a part: all five items together. Net waste is gross waste minus the offcuts that go back on the rack and are actually used on later jobs. When you express net waste as a percentage, the denominator changes too: because the offcut came back, the material consumed is the stock area used minus the offcut area that was reused.
Net waste % = (stock − parts − offcuts reused) ÷ (stock − offcuts reused) × 100
Report both and neither can mislead on its own. Gross waste tells you how much material the job opened up; net waste tells you how much you actually lost over time.
Do offcuts count as waste?
Short answer: an offcut stops being waste only if it is actually used. Fraunhofer ITWM's page on cutting problems puts it plainly: not all offcuts are waste; you can end up with usable by-products such as roof battens or longer pieces of wood that can be reused economically, and the primary goal is to avoid offcuts without sales opportunities (Fraunhofer ITWM).
The counter-warning matters just as much. As one cutting software maker puts it, unless offcuts are tracked and reused systematically, they create a false sense of recovery (MaxCut). Deduct every offcut you shelve and your waste figure looks good while your purchasing stays exactly the same.
Our practical test (not from a source, just workshop sense): if an offcut is labelled with its size, kept in a known place, and checked before a new sheet is opened on the next job, deduct it from net waste at the moment it is used. If either condition is missing, the offcut stays in gross waste; sitting on a rack does not stop it being waste. Some calculators never ask the question: in the example on the calculator site mentioned above, waste shows up as the difference between the area bought and the part area, with no mention of offcuts, so the figure it gives is gross.
The minimum offcut size
A threshold decides which leftover is a “reusable offcut” and which is scrap: anything without two sides over a set size is not kept. Lowering the threshold gives you more offcuts but no less waste; it is the same material with a different label. What actually lowers waste is using those offcuts on the next job.
The last sheet: layout waste vs job waste
The plan says 28% waste, yet the sheets on screen look full. Usually the culprit is the last sheet. Worked example B: a three-sheet job, all three sheets the same size.
| Sheet | Share covered by parts |
|---|---|
| 1 | 92% |
| 2 | 92% |
| 3 | 30% |
| Gross job waste | 1 − (0.92 + 0.92 + 0.30) ÷ 3 = 28.7% |
Each of the first two sheets was cut with 8% waste; what pushes job waste up to 28.7% is the unused 70% of the third. Now assume that 70% goes back on the rack as a single offcut and gets used on the next job (to keep the arithmetic simple, we count the whole remainder as offcut). Material consumed becomes 3 − 0.70 = 2.30 sheets, while the parts still cover 2.14 sheets' worth of area. Net waste is (2.30 − 2.14) ÷ 2.30 = 7.0%. Same plan, two honest numbers: 28.7% gross, 7.0% net.
Some optimizers show this split as two separate numbers, often labelled layout waste and job waste. If the two percentages on the same screen differ, nothing is broken: one may be counting the empty end of the last sheet and the other not.
Percentages do not average
At month end it is tempting to list each job's waste percentage and average them. Worked example C: two jobs on the same sheet size. The first uses 1 sheet at 10% waste, the second 10 sheets at 30% waste. The average of the percentages is 20%; the real total waste is (1 × 0.10 + 10 × 0.30) ÷ 11 = 28.2%. A big job does not weigh the same as a small one.
For a monthly report, sum total stock area and total part area separately and take the ratio at the very end. The same rule applies to sales maps; see why rates do not add up. One caveat: within a single job and a single sheet size, a plain average of the per-sheet fill percentages does give the right job figure (as in example B), because every sheet has the same denominator. What breaks the average is different denominators.
Turning a waste factor into an order: adding 15% is not 15% waste
If you expect 15% waste, how much stock should you order? The most common mistake is multiplying the net requirement by 1.15. The right move is dividing it by (1 − waste). Worked example D: 100 m² of net parts, 15% expected waste, the same 5.796 m² example sheet.
| Adding 15% | Dividing by (1 − 0.15) | |
|---|---|---|
| Area bought | 100 × 1.15 = 115 m² | 100 ÷ 0.85 = 117.65 m² |
| Left after 15% waste | 115 × 0.85 = 97.75 m² (short) | 117.65 × 0.85 = 100 m² |
| Sheets | 115 ÷ 5.796 = 19.8 → 20 sheets | 117.65 ÷ 5.796 = 20.3 → 21 sheets |
The difference is one sheet, and one sheet short in the middle of a job can cost you a day. The cause is two different denominators: 15% waste is measured against the material bought, while “adding 15%” applies it to the requirement. If you prefer to add on, use the figure measured against part area, as in example A: 15% waste means adding 17.65% on top of what you need. A forum discussion in WoodWeb's knowledge base makes the same point for rough lumber: with 30% waste, 100 board feet net needs about 142.86 bought, not 130, and as one contributor put it, adding on is markup while dividing gives you the margin you want (WoodWeb).
The waste factor you plug in should come from your own past jobs, not from a threshold you found online: the net waste of similar jobs if you really do use your offcuts, the gross waste if you do not. How to collect that figure is the last section of this article.
What the free optimizer's “Waste” figure counts
If you produce your cutting plans with our own free optimizer, it helps to know exactly what the “Waste” box at the top of the results counts. In short: the tool reports gross waste.
- The denominator is the full size of every sheet or bar used, with no edge trim taken off. Kerf, edge trim, the reusable offcuts it lists and the empty part of the last stock are all inside the waste percentage.
- The “Reusable offcuts” box shows how many offcuts there are; it does not take anything off the waste percentage.
- A leftover counts as an offcut when both of its sides reach the “Min. reusable offcut” threshold (150 mm by default). On sheets, two kinds of leftover are listed as offcuts: the full-length strip left at the top of the sheet and the piece left at the right-hand end of each strip. Small gaps inside the columns go to waste.
- Among plans that use the same number of sheets, the tool picks the one whose last sheet is emptiest. That gathers the spare material in one place and makes the offcut that goes back on the rack bigger, which is the practical side of the last-sheet arithmetic above.
For net waste, add up the sizes of the green “Offcut” rows in the on-screen cut list (or the “Offcut:” rows in the PDF) that you will genuinely use, and subtract them from the gross figure. The list you get with “Copy cut list” contains only parts, not offcuts. And when you compare two plans from “Try again”, remember that with the same number of sheets and the same parts placed, gross waste is identical; the difference between the plans is where the leftover ends up and in how many pieces.
The tool does not calculate net waste or cost, and it does not remember your offcuts; that record is yours. Paste your part list into the free cut list optimizer: it needs no sign-up, runs in your browser, and the list you enter never leaves it.
Build your own benchmark: four numbers per job
The most reliable answer to “what is normal waste for me?” is your own records. Keep four numbers for every job:
- Stock area used (sheets × sheet area).
- Part area.
- Offcut area put back on the rack.
- Of that, the area actually used on later jobs.
Numbers 1 and 2 give you gross waste; number 4 gives you net waste. The gap between 3 and 4 is offcut sitting on the rack unused, and the bigger it gets, the more your net waste exists only on paper. At month end, sum the four columns separately and take the ratios last. After a few months, the figure you have is a far more meaningful “normal” than any threshold online, because it measures your material, your part sizes and your saw.