
Someone puts a downtime Pareto chart in front of you: the tallest bar on the left, shorter ones trailing off to the right. The question looks simple: which one do we fix first? The usual answer is “the biggest one”, and it is often not wrong. But whether the chart is drawn by minutes or by count, whether planned stops are in it, and whether the tallest bar came from one bad day can all change what job one should be. Most of what you find online assumes a machine-monitoring system feeding the chart. This article is for the shop where the operator records the stop, and the question is what to do with the ranking.
The short answer: a downtime Pareto is not an answer, it is a priority list. Lost time sets the order, but before you put effort into the top bar, check whether it is planned, a one-off, or “no reason”. Below we walk through that with one worked example.
What a Pareto tells you, and what it doesn't
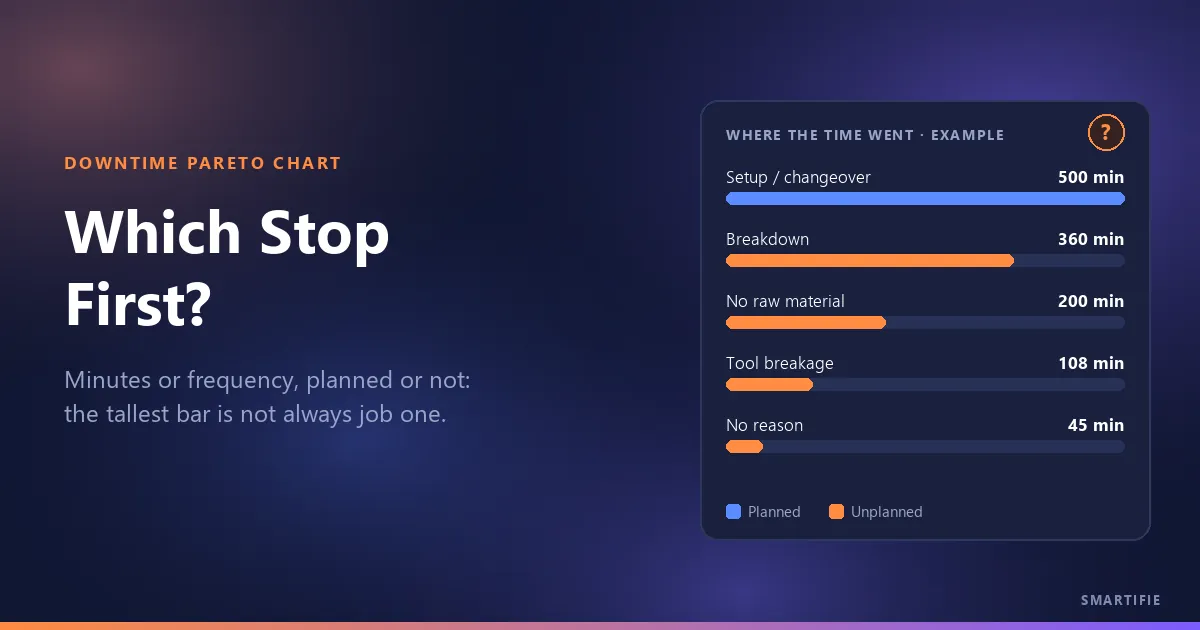
A Pareto chart shows categories as bars sorted from largest to smallest; the point is to separate the few big items from the many small ones. Applied to downtime, it answers one question: where did the time go? Which reasons took the most time over the period?
What it does not tell you is why the stop happened. If the “No raw material” bar is long, the chart will not say whether the problem sits with purchasing, scheduling or the stockroom; root cause is a separate job. The famous 80/20 is an observation, not a rule: in your data the top two reasons might carry half the loss, or nine-tenths of it. What matters is not the ratio but the ranking itself, and what the ranking rests on.
The data behind a Pareto is made at the moment of the stop
The chart is only as good as the list underneath it. When stops are written up from memory at the end of the shift, three things happen: durations get rounded, short stops never make it onto paper, and whatever nobody remembers lands in “Other”. A Pareto drawn from that list shows you what was easiest to write down, not what cost the most time.
It is the stop-side version of the rule in what a labor ticket should record: the record is made at the machine, while it happens. For stops, that gives two rules: the reason is picked at the moment of the stop, at the terminal, and after a long stop, the job does not restart until a reason is given.
In Smartifie Start Stop, every time the operator presses STOP the terminal asks “Why did it stop?”. The first tiles are the reasons used most recently at that terminal, so the usual one is found without scrolling, and there is a search across all reasons. If the reason is not on the list, the operator types it and the office assigns its category later. For a short stop, “I will say later” lets the job pause without a reason; but if the stop ran past the threshold (two minutes by default), the terminal asks for the reason before the job can start again. How to group the reasons themselves is a separate topic; setting up the stop reason list is covered in the guide.
You can watch how the operator picks the reason at STOP, and how the list looks in the office, in the three-minute video below. The people, work orders and fourteen days of stops in it are fictional.
Watch how it works
Real screens, start to finish.

Track Downtime Reasons and See the Pareto | Smartifie Start Stop
How to record why a job stopped at the shop-floor terminal, and where the office sees which stops cost the most time over the last 14 days.
The video loads from YouTube when you press play.
By minutes or by count?
The same list of stops gives two different rankings. By minutes, it tells you how much time you lost; by count, how often you got interrupted. If the goal is to win back lost time, start with minutes: a few reasons take most of the time, and the minutes ranking is how you find them. The count ranking shows something else: stops that are short one by one but keep coming back are the ones that break the operator's rhythm, and they need a different fix, usually not a repair but an adjustment, a fixture or a habit.
Example (made-up data): unplanned stops over the last 14 days.
| Reason | Stops | Total time | Rank (minutes) | Rank (count) |
|---|---|---|---|---|
| Breakdown | 1 | 360 min | 1 | 4 |
| No raw material | 5 | 200 min | 2 | 3 |
| Tool breakage | 9 | 108 min | 3 | 2 |
| No reason (short stops) | 30 | 45 min | 4 | 1 |
| Unplanned total | 45 | 713 min | ||
| Setup / changeover (planned, kept apart) | 20 | 500 min | — | — |
By minutes, Breakdown comes first, but it is a single event: once, for six hours. By count, “No reason” comes first: 30 stops that add up to only 45 minutes. Look at both rankings together and one reason stands out: tool breakage is third by minutes and second by count; it costs time and it keeps happening. That is the practical method: build the minutes ranking first, then write the number of stops next to each row. Why the planned setup line sits apart is covered further down.
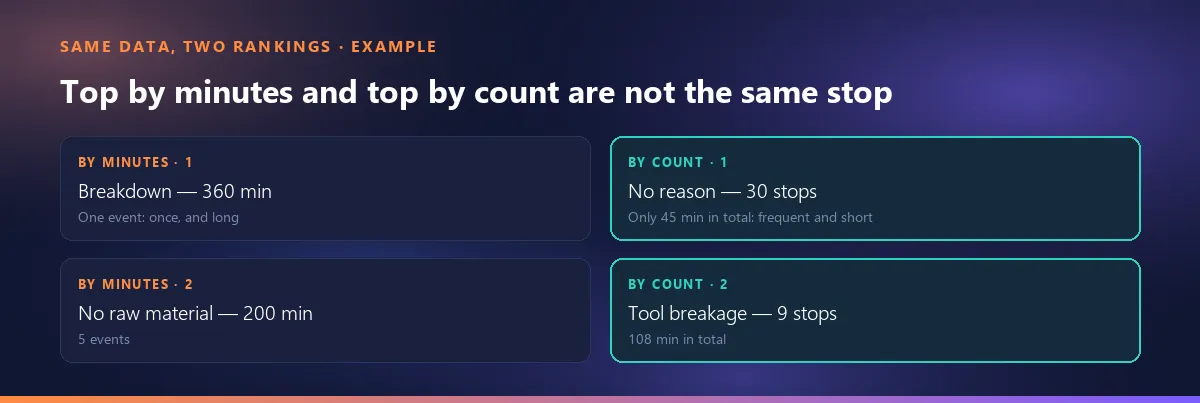
Smartifie Start Stop's Overview screen ranks reasons by time; it does not show a separate ranking by count. The count column, if you want one, belongs in your own spreadsheet.
Cumulative percentage: how to work it out by hand
The line that runs above the bars on a Pareto chart is the cumulative percentage: once the reasons are sorted by time, it shows at each step the running total as a share of the grand total. It takes three steps: sort the times from largest to smallest; on each row, write the sum of that row and every row above it; divide that running total by the grand total and multiply by 100.
| Reason | Time | Running total | Cumulative % |
|---|---|---|---|
| Breakdown | 360 min | 360 min | 50.5 |
| No raw material | 200 min | 560 min | 78.5 |
| Tool breakage | 108 min | 668 min | 93.7 |
| No reason | 45 min | 713 min | 100.0 |
The math: 360 / 713 × 100 = 50.5; (360 + 200) / 713 × 100 = 78.5; (360 + 200 + 108) / 713 × 100 = 93.7. Where the line climbs steeply and then flattens is where the “few big reasons” end: in this example the top two carry roughly three-quarters of the unplanned loss. The planned setup was left out of this on purpose; put it in and it tops the list, and every percentage answers a different question.
Smartifie Start Stop's panel does not draw this line: the bars are scaled to the largest reason and do not show a share of the total. If you want the cumulative percentage, do these three steps in your own spreadsheet.
What the “No reason” and “Other” bars are telling you
Stops with no known reason should be neither deleted nor folded into “Other”. They belong on their own bar, because it is the only bar on the chart you can still fix: a supervisor can ask the operator and enter the reason afterwards. A breakdown or tool bar only gets shorter through work on the floor; the “No reason” bar gets shorter through a conversation. A long “No reason” bar is a data problem, not a production problem, and it should come down before you read the rest of the ranking, or everything else rests on missing data.
“Other” tells you something different. If it is big, your reason list has gaps: the operator cannot find a reason that fits and falls back on the catch-all. Finding out what those stops are and adding them to the list by name splits the bar and brings the real reason into view. The “No reason” row in the example follows a typical pattern too: 30 stops, 45 minutes in total; last by minutes, first by count. Most of them are short stops. How short a stop has to be before it can go without a reason is a separate decision, and we will cover it in another article.
In Smartifie Start Stop, stops without a reason appear on their own row as “No reason” and are not folded into “Other”. The “N records need a look” card on the Overview screen counts unexplained stops along with other records to check, and its “Review” button takes you to the list. A stop that is still running is not drawn on the chart, because its length is not known yet, but if it has no reason it is counted on that card. The product does not fill in an unexplained stop by itself; it shows it to a supervisor, and adding the reason afterwards is a record correction that needs a justification and is available on paid plans.
The tallest bar is not always job one
Ranking by minutes is the right starting point, but before you pour all the effort into the top bar, check for three traps.
1. One long breakdown versus a short stop that comes back every shift
In the example, Breakdown is first with 360 minutes, but it is a single event: once, for six hours. Tool breakage is third with 108 minutes, but it happened 9 times in 14 days, almost every working day. The one-off breakdown may never happen again; the tool breakage will be back next week. The question to ask is: will this bar still be here next period? The breakdown deserves a root-cause look, of course, but the payback from prevention is more predictable on the stop that repeats. The “Last two weeks” bars on Smartifie Start Stop's Overview screen help tell the two apart: each day's net time and downtime sit side by side, so one long breakdown shows up as a single amber spike on one day, while a repeating stop spreads across the days.
2. A planned stop can be the biggest one
In the example, setup is the single biggest item on the whole list at 500 minutes. It is not a breakdown; there is nothing to repair, there is a process to shorten. Put it in the same ranking as unplanned stops and the top bar gets tied to the wrong question: people look for what broke, and find nothing. Setup needs to be handled on its own; more on that in the next section.
3. If the period is short, one bad day sets the order
In a week's worth of data, a single breakdown day can outrank everything. Keep the period long enough for repeating stops to show up several times, and compare the ranking with the next period of the same length; a reason that stays near the top in both is a safer bet than one picked from a single period.
The decision rule: put first what repeats, what can be prevented, and what is in your hands. If “No raw material” depends on a supplier, it is not the shop floor's to fix but scheduling's or purchasing's; the bar is the same, the owner is someone else. Assigning each bar to the right person is as much a part of the Pareto as reading the order.
Should planned stops stay on the chart?
Breaks and lunch are not a loss; they are planned by definition. Changeovers and planned maintenance do cost time, but they are not “breakdowns”. There are two easy options here, and both lose information. Delete planned stops from the chart and you stop seeing setup times grow. Leave them in the same color and, as in the example, the tallest bar looks like something broke.
What we suggest, as one approach: do not delete planned stops; show them in a different color. That way one chart answers two separate questions: “what do we fix?” (unplanned) and “what do we shorten?” (planned). There is no single accepted standard for this; some shops track planned stops on a separate chart altogether. What matters is not mistaking one for an answer to the other. Smartifie Start Stop, a shop-floor app that asks for the stop reason at the terminal, shows both on the same list on its Overview screen, in different colors: planned stops in blue, unplanned in amber.
After you pick the first bar: check it next period
A Pareto is not a report you draw once and pin to the board; it is a check you repeat every period. For the reason you picked, look for the root cause first (a common method is the “5 Whys”: asking “why?” several times in a row), then name an owner and a date. Then, over the next period of the same length, check whether that bar got shorter. If it did not, either the root cause was wrong or the fix never happened; both are worth knowing.
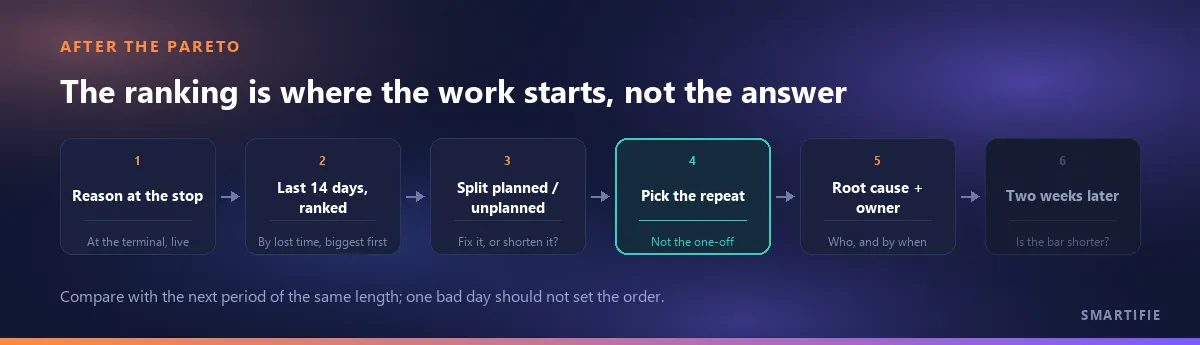
Smartifie Start Stop's Overview screen always shows the last 14 days, today included. So the comparison needs no separate report: looking at the same screen two weeks after the fix is looking at the next period.
In short: lost time sets the order; before you invest in the top bar, check whether it is planned, a one-off or “No reason”, and measure your pick again two weeks later.
If you want to collect stop reasons in your own shop, at the moment they happen, you can try Smartifie Start Stop free for 15 days, no credit card required. The trial runs in the cloud, in the browser; the terminal, stop reasons and the Overview screen are all part of it.